I really don’t think it can be overestimated how important context can be when it comes to troubleshooting or evaluating the health of an infrastructure. When starting to troubleshoot a complex problem, web ops 101 “best practices” usually start with asking at least these questions:
- When did this problem start?
- What changes, if any, (software, hardware, usage, environmental, etc.) were made just previous to the start of the problem?
The context surrounding these problem events are pretty damn critical to figuring out what the hell is going on.
Most monitoring systems are based around the idea that you want to know if a particular metric is above (or sometimes below) a certain threshold, and have ‘warning’ or ‘critical’ values that represent what is going bad or already bad. When these alarms go off, knowing how and when they got there is really important your troubleshooting approach. This context is paramount in figuring out where to spend your time and focus.
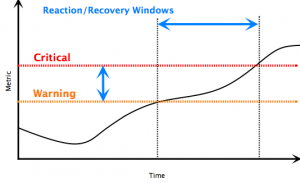
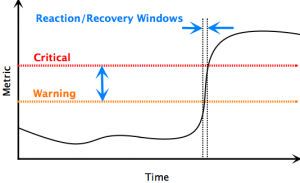
For example: an alarm goes off because a monitor has detected that some metric has reached a critical state. Something that goes critical instantly can be quite different than something that edged into critical after being in a warning state for some time.
Check it out:
For this discussion, the actual metric here isn’t that important. It could be CPU on a webserver, it could be latency on a cache hit or miss on memcached/squid/varnish/etc, or it could be network bandwidth on a rack switch. The values you set for warning and critical are normally informed by how much tolerance the system can withstand being in warning mode, and given ‘normal’ failure modes, and allow enough wall-clock time for recovery actions to take place before it reaches critical.
Most people would approach these two scenarios quite differently, because of the context that time lends to the issue.
In the book, I give an example of how valuable this context is in troubleshooting interconnected systems. When metrics from different clusters or systems are laid right next to each other, significant changes in usage can be put into the right context. Cascading failures can be pretty hard to track down to begin with. Tracking them down without the big picture of the system is impossible. That graph you’re using for troubleshooting: is it showing you a cause, or symptom?
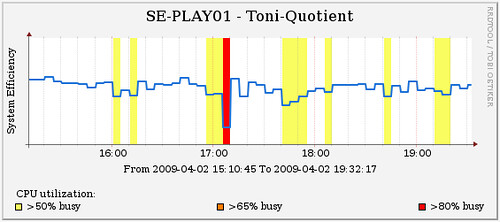
Because context is so important, I’m a huge fan of overlaying higher-level application statistics with lower-level systems ones. This guy has a great example of it over on the Web Ops Visualization group pool:
He’s not just measuring the webserver CPU, he’s also measuring the ratio of requests per second to total CPU. This is context that can be hugely valuable. If any of the underlying resources change (faster CPUs, more caching on the back-end, application optimizations, etc.) he’ll be able to tell quickly how much benefit he’ll gain (or lose) by tracking this bit.
At the Velocity Summit, Theo mentioned that since OmniTI started throwing metrics for all their clients into reconnoiter, they almost always plot their business metrics on top of their system metrics, because why the hell not? Even if there’s no immediate correlation, it gives their system statistics the context needed for the bigger picture, which is:
How is my infrastructure actually enabling my business?
I’ll say that gathering metrics is pretty key to running a tight ship, but seeing them in context is invaluable.


![Reblog this post [with Zemanta]](http://img.zemanta.com/reblog_e.png?x-id=85f7a8e8-9a3e-4b46-ac8f-418b8b19491d)
Great post, John!
I think there’s other examples of context enabling metrics that are not necessarily based on relationships between traditional ops metrics (as your example suggests). For example, we’ve worked with folks who track the number of photo uploads, or new subscribers alongside all the rest of their ops metrics and events. These “business” metrics are understood by both ops and the business folks, and at sufficiently mature sites behave in fairly consistent patterns. A lot of our customers start by tracking anomalies in these metrics and work their way down from there to diagnosing the problem.
Exposing this context is something developers should have an active hand in and too often are not. I’m eager to learn ways in which dev and ops are working together to make this more a reality for anyone doing scaled out webapps.
See you at Velocity.
-javier
I think you can go even further than just offering contextual counters but also correlating the rate of change in such counters with the context of the activity chain which activities associated with one or more cost groups (centers) that can represent the business domain, implementation codebase, or user activity.
You might find the following links useful – as low or as high as you want to go.
Execution Profiling: Counting KPI’s
http://williamlouth.wordpress.com/2009/05/04/execution-profiling-counting-kpis/
ABC for Cloud Computing
http://williamlouth.wordpress.com/2009/01/27/abc-for-cloud-computing/
Pingback: JIRA: Development Infrastructure
Pingback: DevOps Cooperation Doesn’t Just Happen With Deployment
Pingback: The Devil’s In The Details
Pingback: System metrics and context matter! | mjay