I make it no secret that my background is in mechanical engineering. I still miss those days of explicit and dynamic finite element analysis, when I worked for the VNTSC, working on vehicle crashworthiness studies for the NHTSA.
What was there not to like? Things like cars and airbags and seatbelts and dummies and that get crushed, sheared, cracked, busted in every way, all made of different materials: steel, glass, rubber, even flesh (cadaver studies)…it was awesome.
I’ve made some analogies from the world of statics and dynamics to the world of web operations before (Part I and Part II), and it still sticks in my mind as a fundamental mental model in my every day work: resources that have adaptive capacities have a fundamental relationship between stress and strain. Which is to say, in most systems we encounter, as demand for a given resource increases, the strain on the system (and therefore the adaptive capacity) under load also changes, and in most cases increases.
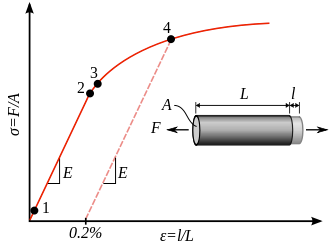
What do I mean by “resource”? Well, from the materials science world, this is generally a component characterized by its material properties. The textbook example is a bar of metal, being stretched.
À la:
In this traditional case, the “system” is simply a beam or a linkage or a load-bearing something.
But in my extension/abuse of the analogy, simple resources in the first order could be imagined as:
- CPU
- Memory
- Disk I/O
- Disk consumption
- Network bandwidth
To extend it further (and more realistically, because these resources almost never experience work in isolation of each other) you could think of the resource under load to be any combination of these things. And the system under load may be a webserver. Or a database. Or a caching server.
Captain Obvious says: welcome to the underlying facts-on-the-ground of capacity planning and monitoring. 🙂
To me, this leads to some more questions:
-
- What does this relationship look like, between stress and strain?
- Does it fail immediately, as if it was brittle?
- Or does it “bend”, proportionally, (as in: request rate versus latency) for some period before failure?
- If the latter, is the relationship linear, or exponential, or something else entirely?
- Was this relationship known before the design of the system, and therefore taken into account?
- Which is to say: what approaches are we using most in predicting this relationship between stress and strain:
- Extrapolated experimental data from synthetic load testing?
- Previous real-world production data from similarly-designed systems?
- Percentage rampups of production load?
- A few cherry-picked reports on HackerNews combined with hope and caffeine?
- Which is to say: what approaches are we using most in predicting this relationship between stress and strain:
- Will we be able to detect when the adaptive capacity of this system is nearing damage or failure?
- If we can, what are we planning on doing when we reach those inflections?
- What does this relationship look like, between stress and strain?
The more confidence we have about this relationship between stress and strain, the more prepared we are for the system’s failures and successes.
Now, the analogy of this fundamental concept doesn’t end here. What if the “system” under varying load is an organization? What if it’s your development and operations team? Viewed on a longer scale than a web request, this can be seen as a defining characteristic of a team’s adaptive capacities.
David Woods and John Wreathall discuss this analogy they’ve made in “Stress-Strain Plots as a Basis for Assessing System Resilience”. They describe how they are mapping the state space of a stress-strain plot to an organization’s adaptive capacities and resilience:
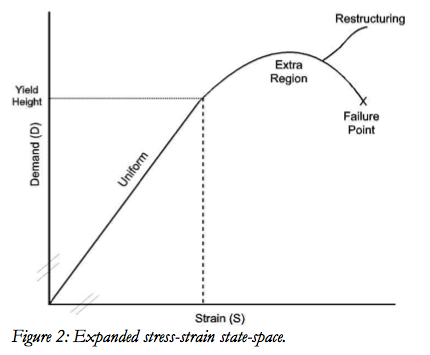
Following the conventions of stress- strain plots in material sciences, the y-axis is the stress axis. We will here label the y-axis as the demand axis (D) and the basic unit of analysis is how the organization responds to an increase in D relative to a base level of D (Figure 1). The x-axis captures how the material stretches when placed under a given load or a change in load. In the extension to organizations, the x-axis captures how the organization stretches to handle an increase in demands (S relative to some base).
In the first region — which we will term the uniform response region — the organization has developed plans, procedures, training, personnel and related operational resources that can stretch uniformly as demand varies in this region. This is the on-plan performance area or what Woods (2006) referred to as the competence envelope.
As you can imagine, the fun begins in the part of the relationship above the uniform region. In materials science, this is where plastic deformation begins; it’s the point on the curve at which a resource/component’s structure deforms under the increased stress and can no longer rebound back to its original position. It’s essentially damaged, or its shape is permanently changed in the given context.
They go on to say that in the organizational stress-strain analogy:
In the second region non-uniform stretching begins; in other words, ‘gaps’ begin to appear in the ability to maintain safe and effective production (as defined within the competence envelope) as the change in demands exceeds the ability of the organization to adapt within the competence envelope. At this point, the demands exceed the limit of the first order adaptations built into the plan-ful operation of the system in question. To avoid an accumulation of gaps that would lead to a system failure, active steps are needed to compensate for the gaps or to extend the ability of the system to stretch in response to increasing demands. These local adaptations are provided by people and groups as they actively adjust strategies and recruit resources so that the system can continue to stretch. We term this the ‘extra’ region (or more compactly, the x-region) as compensation requires extra work, extra resources, and new (extra) strategies.
So this is a good general description in Human Factors Researcher language, but what is an example of this non-uniform or plastic deformation in our world of web engineering? I see a few examples.
- In distributed systems, at the point at which the volume of data and request (or change) rate of the data is beyond the ability for individual nodes to cope, and a wholesale rehash or fundamental redistribution is necessary. For example, in a typical OneMasterManySlaves approach to database architecture, when the rate of change on the master passes the point where no matter how many slaves you add (to relieve read load on the master) the data will continually be stale. Common solutions to this inflection point are functional partitioning of the data into smaller clusters, or federating the data amongst shards. In another example, it could be that in a Dynamo-influenced datastore, the N, W, and R knobs need adjusting to adapt to the rate or the individual nodes’ resources need to be changed.
- In Ops teams, when individuals start to discover and compensate for brittleness in the architecture. A common sign of this happening is when alerting thresholds or approaches (active versus passive, aggregate versus individual, etc.) no longer provide the detection needed within an acceptable signal:noise envelope. This compensation can be largely invisible, growing until it’s too late and burnout has settled in.
- The limits of an underlying technology (or the particular use case for it) is starting to show. An example of this is a single-process server. Low traffic rates pose no problem for software that can only run on a single CPU core; it can adapt to small bursts to a certain extent, and there’s a simple solution to this non-multicore situation: add more servers. However, at some point, the work needed to replace the single-core software with multicore-ready software drops below the amount of work needed to maintain and grow an army of single-process servers. This is especially true in terms of computing efficiency, as in dollars per calculation.
In other words, the ways a design or team once adapted are no longer valid in this new region of the stress-strain relationship. Successful organizations re-group and increase their ability to adapt to this new present case of demands, and invest in new capacities.
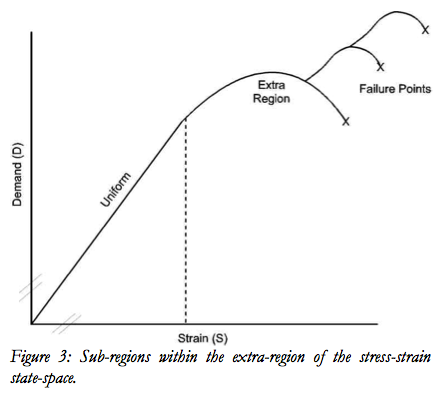
For the general case, the exhaustion of capacity to adapt as demands grow is represented by the movement to a failure point. This second phase is represented by the slope and distance to the failure point (the downswing portion of the x-region curve). Rapid collapse is one kind of brittleness; more resilient systems can anticipate the eventual decline or recognize that capacity is becoming exhausted and recruit additional resources and methods for adaptation or switch to a re-structured mode of operations (Figures 2 and 3). Gracefully degrading systems can defer movement toward a failure point by continuing to act to add extra adaptive capacity.
In effect, resilient organizations recognize the need for these new strategies early on in the non-uniform phase, before failure becomes imminent. This, in my view, is the difference between a team who has ingrained into their perspective what it means to be operationally ready, and those who have not. At an individual level, this is what I would consider to be one of the many characteristics that define a “senior” (or, rather a mature) engineer.
This is the money quote, emphasis is mine:
Recognizing that this has occurred (or is about to occur) leads people in these various roles to actively adapt to make up for the non- uniform stretching (or to signal the need for active adaptation to others). They inject new resources, tactics, and strategies to stretch adaptive capacity beyond the base built into on-plan behavior. People are the usual source of these gap-filling adaptations and these people are often inventive in finding ways to adapt when they have experience with particular gaps (Cook et al., 2000). Experienced people generally anticipate the need for these gap-filling adaptations to forestall or to be prepared for upcoming events (Klein et al., 2005; Woods and Hollnagel, 2006), though they may have to adapt reactively on some occasions after the consequences of gaps have begun to appear. (The critical role of anticipation was missed in some early work that noticed the importance of resilient performance, e.g., Wildavsky, 1988.)
This behavior leads to the extension of the non-uniform space into new uniform spaces, as the team injects new adaptive capacities:
There is a lot more in this particular paper that Woods and Wreathall cover, including:
- Calibration – How engineering leaders and teams view themselves and their situation, along the demand-strain curve. Do they underestimate or overestimate how close they are to failure points or active adaptations that are indicative of “drift” towards failure?
- Costs of Continual Adaption in the X-Region – As the compensations for cracks and gaps in the system’s armor increase, so does the cost. At some point, the cost of restructuring the technology or the teams becomes lower than the continual making-up-for-the-gaps that are happening.
- The Law of Stretched Systems – “As an organization is successful, more may be demanded of it (‘faster, better, cheaper’ pressures) pushing the organization to handle demands that will exceed its uniform range. In part this relationship is captured in the Law of Stretched Systems (Woods and Hollnagel, 2006) — with new capabilities, effective leaders will adapt to exploit the new margins by demanding higher tempos, greater efficiency, new levels of performance, and more complex ways of work.”
Overall, I think Woods and Wreathall hit the nail on the head for me. Of course, as with all analogies, this mapping of resilience and adaptive capacity to stress-strain curves has limits and they are clear on pointing those out as well.
My suggestion of course is for you to read the whole chapter. It may or may not be useful for you, but it sure is to me. I mean, I embrace the concept so much that I got a it printed on a coffee mug, and I’m thinking of making an Etsy Engineering t-shirt as well. 🙂


This is the same graph talked about in CS Performance Classes (at least at the school I went to). Basically the system allows for calls that can grow to a saturation point then fails.
Some common symbols U(t) – Utilization over time
T – throughput
Your throughput grows as long as your system is not 100% utilized at the time when you hit Saturation which is equivalent to Strain (same symbol btw). Failure occurs and @ that point the graph is logarithmic and stops in a dead lock. Basically Scale cannot grow linearly anymore at saturation and failure is around the corner.
Now increasing that Extra Region or moving the saturation point – is very hard at larger and larger amounts of requests which you brilliantly describe.
Its fascinating that two distinct disciplines model the same sort of occurrence. One in the material world and the other in the soft world. Great Job Allspaw and thanks for ‘learning’ me something new today 🙂
1. Assume a smooth, frictionless computer.
Pingback: Humility At Work « ccmolitoris
Pingback: Learning from other disciplines | Standalone Sysadmin
Pingback: 4 Statistical Process Control Rules That Can Detect Anomalies in Your System | VividCortex
Pingback: On Being A Senior Engineer | Kitchen Soap